Every Monday morning, the head of sales at an online electronics store in Bengaluru opens a screen of charts. It shows last week's sales by city, the phones that sold best and how many came back. That screen is called a dashboard.
In Market Segment 8.1, Data integration and governance platforms, the store copied the data from all its systems into one place built for answering questions. That place is the data warehouse. (More on data warehouses in Market Segment 7.1, Databases and data warehouses, in Industry Vertical 7, Database and storage companies.) This Market Segment is about the next step: the software people use to look at that data and get answers from it.
The oldest name for this software is business intelligence, or BI. It covers the report, the dashboard and the chart on the screen in the Monday meeting. Analytics is the broader word. It also covers working out why a number moved, and what it will be next month.
Two groups of people use this software. Analysts are the people whose job is to work with data. They build the dashboards and answer questions from the rest of the company. Managers, like the store's head of sales, read the dashboards and ask the questions.
This Market Segment has a large gap at its centre. The three BI tools most companies actually use are Tableau, Power BI and Looker. Tableau is part of Salesforce. (More on Salesforce in Market Segment 14.1, CRM software, in Industry Vertical 14, CRM and sales tech.) Microsoft's Power BI and Google's Looker are covered elsewhere. (More on them in Microsoft and Google, in the big-tech collection.)
What remains are two kinds of companies. The first are the older BI companies in the second tier, after the big three. The second are young start-ups betting that the dashboard is about to be replaced by a conversation: you type a question, and the software answers it.
Some companies do analytics for their clients as a service, with their own analysts, instead of selling software. The large Indian analytics services firms, such as Fractal, Tiger Analytics and Tredence, work this way. (More on them in the services-world collection.)
Every company named here has posted software engineering jobs in India. Famous companies that don't actively hire software engineers in India are left out.
This Market Segment has three sub-segments:
The dashboard: reports and dashboards built in advance, to be read again and again
Asking in plain language: typing a question and getting the answer on the spot
The analyst's workbench: tools for analysts who prepare the data, analyse it and forecast from it
The dashboard
Enterprise business intelligence, embedded reporting, cloud business intelligence
Take the Monday dashboard from the start of this Market Segment. An analyst built it once, in advance. After that, it refreshes itself from the warehouse, and the head of sales reads the same charts every week. This is the oldest part of the market.
Strategyformerly MicroStrategy, has sold enterprise business intelligence for three decades. Enterprise BI is built for large companies, where thousands of employees read the same reports and each sees only the numbers they are allowed to see. Strategy's engineering in India is in Chennai.
Domonow part of Progress, with engineers in Pune, sells cloud dashboards for executives. Cloud BI runs as a web service, so there is nothing for the buyer to install. Domo comes with data connectors built in. Market Segment 8.1 explains these: code that pulls data out of other apps. (More on Progress in Market Segment 6.1, DevOps and CI/CD tools, in Industry Vertical 6, Devtools companies.)
Some BI tools have a different buyer: software companies. A software company builds the reporting tool into its own product, so that its product can produce reports for the businesses that use it. The industry calls this embedded reporting. A billing app, for example, can use it to produce invoices and monthly reports.
Jaspersoftnow part of HCLSoftware, with engineers in Pune, is an open-source reporting engine. Other software companies embed it in their own products to produce invoices and reports.
Intellicusa business-intelligence company built in Indore, sells the same kind of embedded reporting, and enterprise reporting too. Its buyers are software makers and other organisations, in India and abroad.
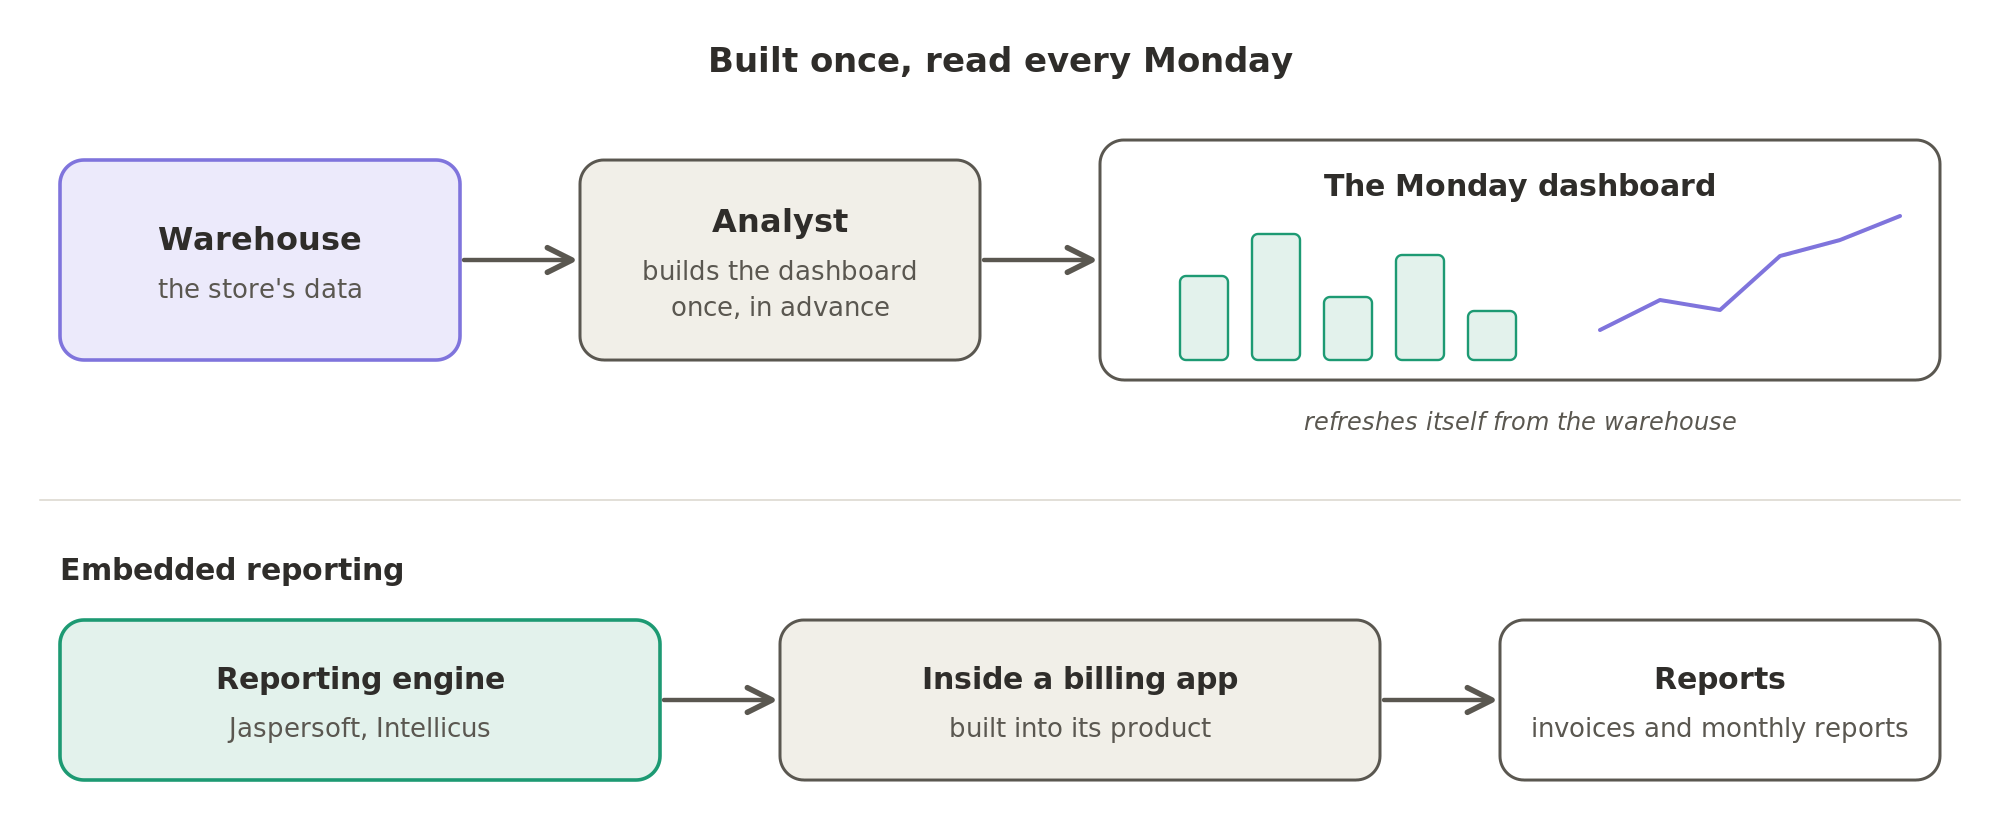 An analyst builds the dashboard once from the warehouse, and it refreshes itself for the Monday meeting; in embedded reporting, the reporting engine is built into another company's product, such as a billing app, to produce its invoices and reports.
Qlik, Sisense and GoodData are not covered in this Market Segment.
Asking in plain language
Search-driven and AI-driven analytics, conversational and agentic analytics, product analytics
Back to the online store from the start of this Market Segment. One Monday, the dashboard shows that returns in Pune have doubled. The head of sales wants to know why. The dashboard can't say, because nobody built a chart for that question. So the head of sales emails an analyst and waits, sometimes for days.
The companies in this sub-segment want managers to type the question and get the answer on the spot. This is the part of the market that is betting on the future. Most of it now runs on large language models, the kind of AI behind tools like ChatGPT. The AI model reads the question, writes the database query, runs it and explains the result. When the AI carries out several steps like these by itself, the industry calls it agentic analytics.
ThoughtSpotwith engineers in Bengaluru and Hyderabad, built analytics around a search box on top of the warehouse. A manager types a question and gets a chart, instead of waiting for an analyst. ThoughtSpot has rebuilt its product around language models as they arrived.
WisdomAIwith engineers in Bengaluru, is a newer version of the same idea. It was founded in 2023 by a team from Rubrik, led by Soham Mazumdar, one of Rubrik's co-founders. Rubrik makes data backup and security software. (More on Rubrik in Market Segment 7.2, Enterprise storage and backup, in Industry Vertical 7, Database and storage companies.) WisdomAI sells an AI business analyst. A company connects it to its data and asks it questions in conversation.
Sundialwith engineers in Bengaluru, sells an AI analyst to technology companies. It started from product analytics: the numbers a consumer app's team watches about its users. Examples are how many users open the app each day, and where they give up during sign-up.
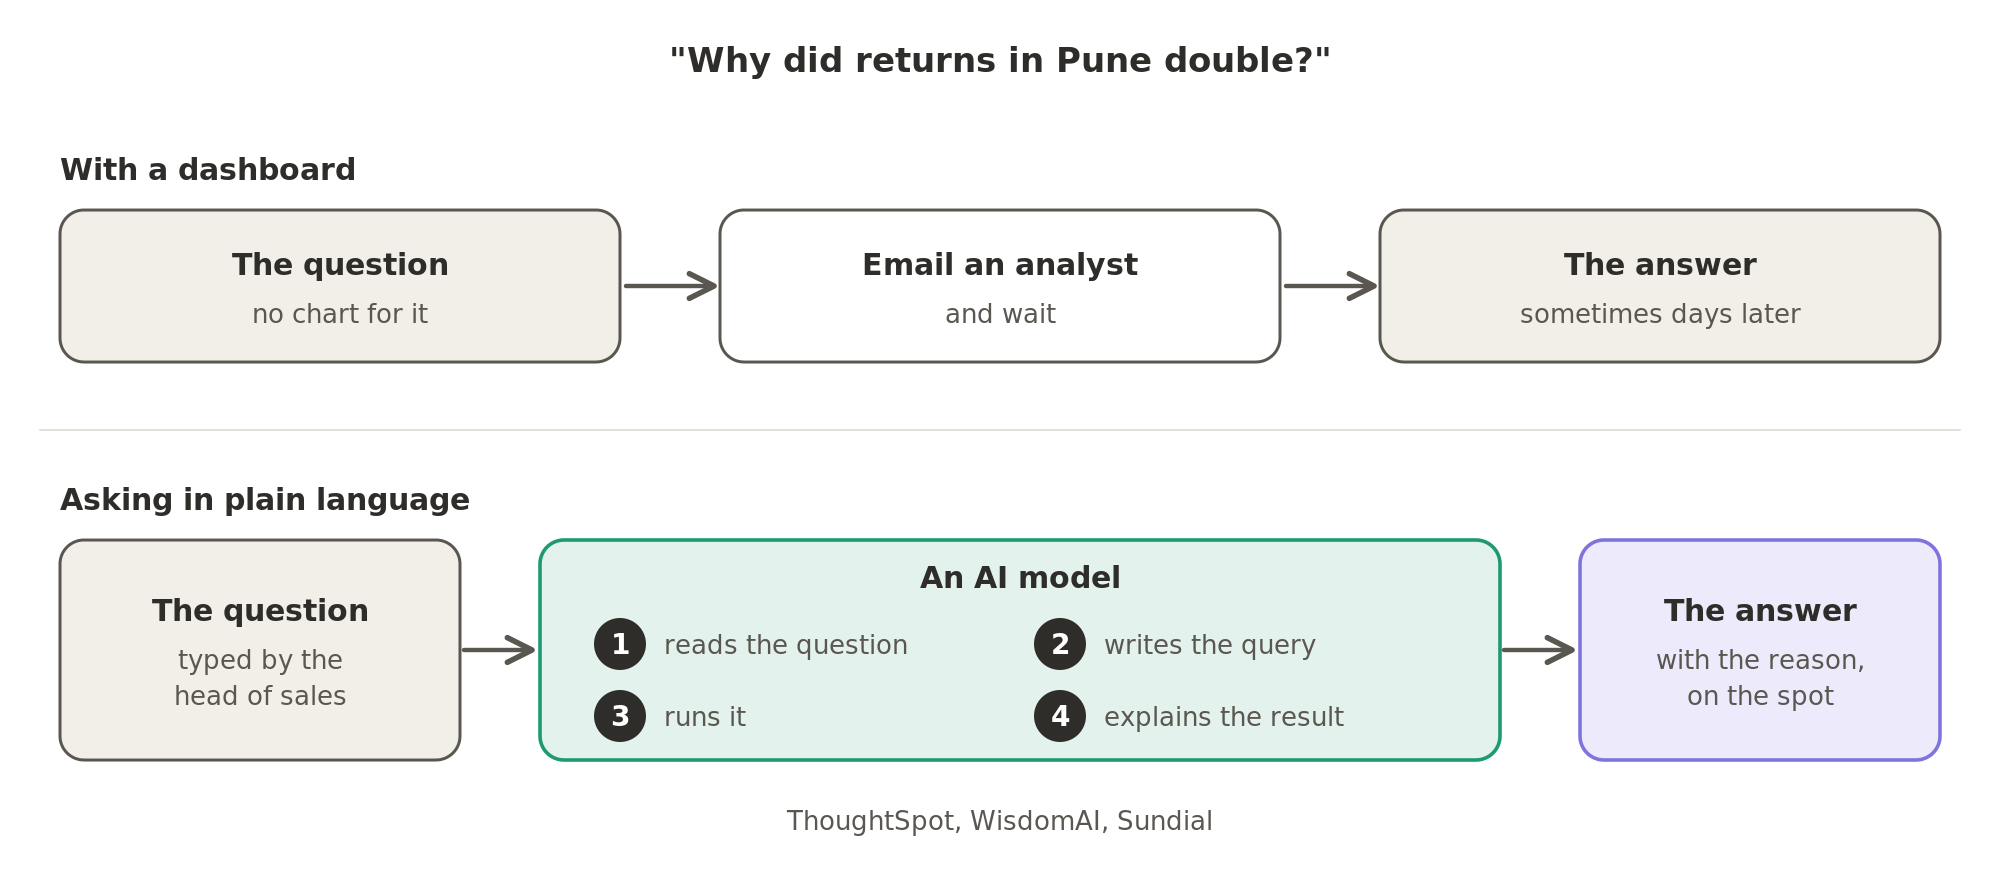 When no chart answers a question, a manager emails an analyst and waits; in analytics that takes questions in plain language, an AI model reads the question, writes the query, runs it and explains the result on the spot.
One company here works differently. AISquared doesn't answer questions itself. It builds the layer that puts AI-generated analysis inside the apps people already work in, so they don't have to open a separate analytics tool.
The analyst as an AI model.
The companies in this sub-segment are building the same thing as the big BI companies missing from it. It is an AI model that takes the question, writes the query, reads the result and explains it. The open question is whether this replaces the dashboard or sits beside it. The answer will reshape this market. Back to the online store: the head of sales would type "Why did returns in Pune double?" and get the answer, with the reason, right away.
Amplitude, Mixpanel and Pendo, the leading product-analytics companies, are not covered in this Market Segment.
You're reading as a guest. Sign in free to follow links for five minutes, once an hour.
Sign in
The analyst's workbench
Analytics automation, statistics platforms, time-series forecasting
Back to the online store once more. Diwali is two months away. The head of sales asks how many of each phone the store should stock. The dashboard shows what sold last Diwali, but it can't predict this one. That work falls to an analyst, and this sub-segment sells the analyst's tools.
Alteryxwith engineers in Bengaluru, sells a workbench for analysts. An analyst builds a workflow by dragging ready-made steps onto a screen, without code: pull the data, clean it, combine it and analyse it. The workflow then runs again every week. The industry calls this analytics automation.
SASwith its engineering in Pune, has been the statistics platform of banks, insurers and pharmaceutical companies since the 1970s. A bank uses it, for example, to estimate the risk that a borrower won't repay. A drug company uses it to analyse the results of clinical trials.
Ikigainow part of Celonis, with engineers in Bengaluru, was founded out of MIT. It sells forecasting models for business data kept in rows and columns, like a spreadsheet. The models work on time series: numbers recorded over time, like daily sales. They answer the planning questions that a dashboard can show but not predict, about demand, inventory and cash. (More on Celonis in Market Segment 10.3, RPA, process mining and low-code platforms, in Industry Vertical 10, ERP and business automation.)
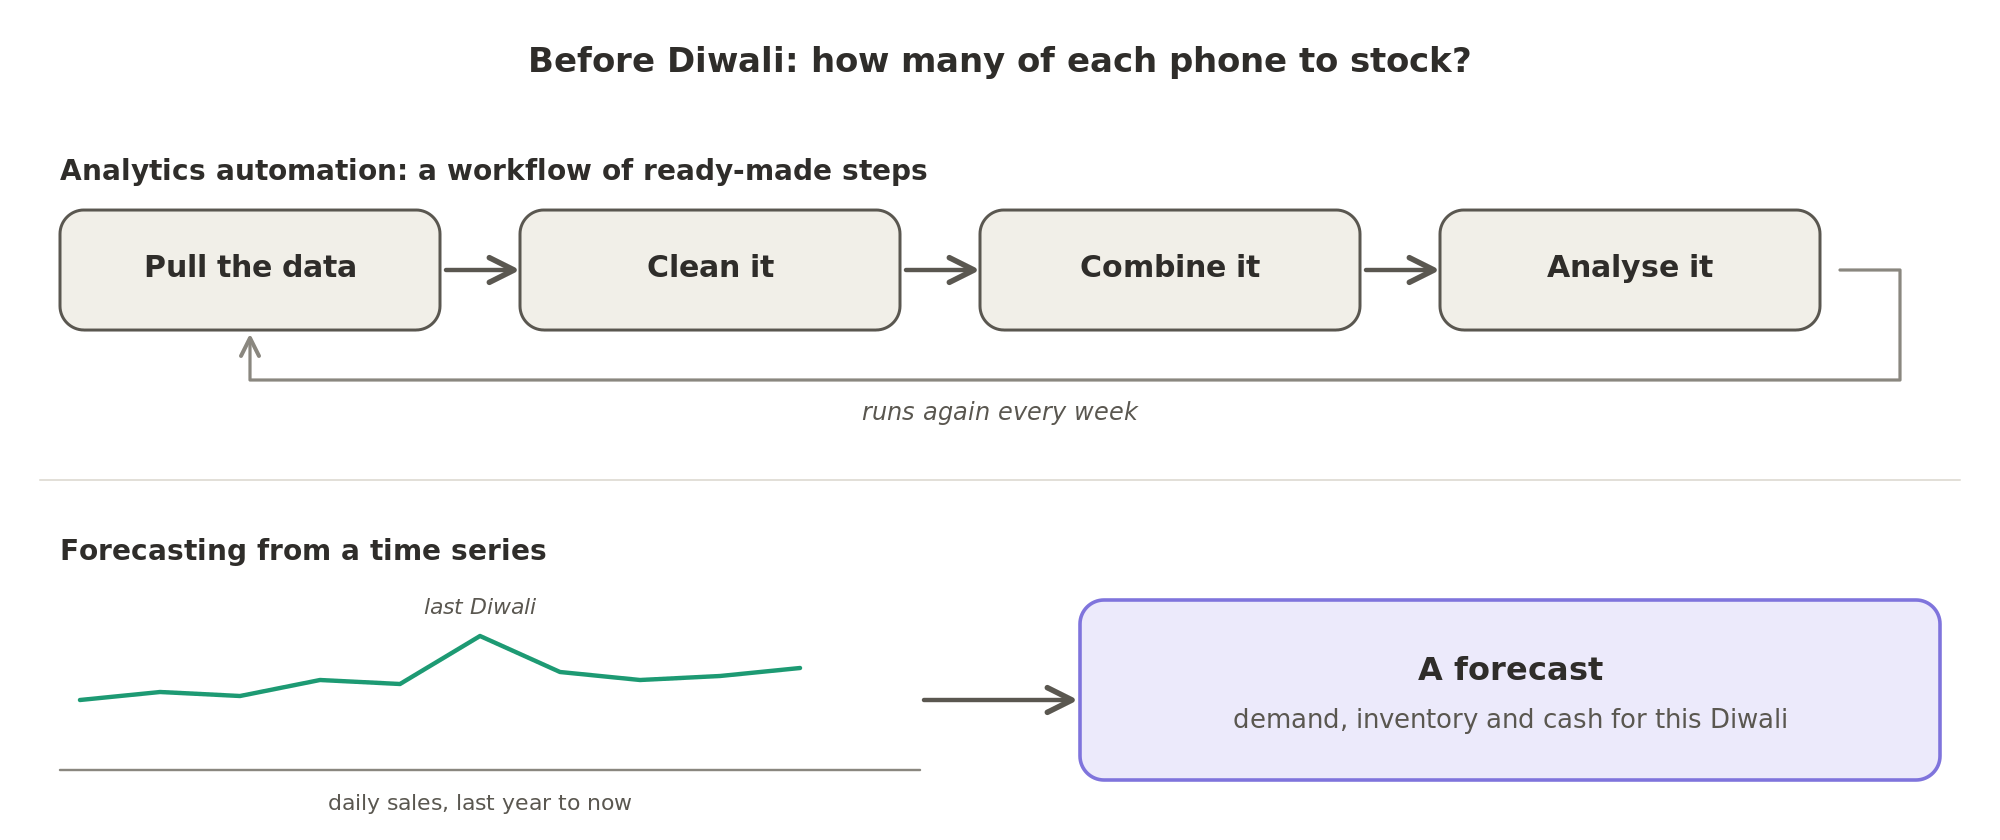 The analyst's workbench: a workflow of ready-made steps that pulls, cleans, combines and analyses the data and runs again every week, and forecasting models that read daily sales over time to plan demand, inventory and cash before Diwali.
Turning the forecast into a budget is a separate job. Planning platforms such as Anaplan do it. (More on them in Market Segment 11.3, Financial close, FP&A and tax software, in Industry Vertical 11, Finance and accounting software.)
That is how a company looks at its data. There is the dashboard read every Monday, the question typed in plain language, and the analyst's forecast of how many phones to stock before Diwali.