It is three in the morning at a food-delivery company in Bengaluru. Late-night orders have started failing, and an alert goes off on the phone of the engineer on call. The engineer on call is the one who has to respond when something breaks, even at night.
Once the code is in production, the live system that customers use, the question changes. It is no longer whether the code works. It is whether it is working now, for how many users, and if not, why not.
A modern application is hundreds of services running on thousands of machines. Nobody can watch it just by looking. So it has to be instrumented: code is added so that every request, every error and every slow database call is recorded. These records come in three kinds, and the industry has a name for each:
Metricsare numbers measured over time, such as how many orders go through each minute.
Logsare the lines of text a program writes as it runs, such as "payment failed for order 1234".
Tracesfollow one request, such as one customer's order, through every service it touched.
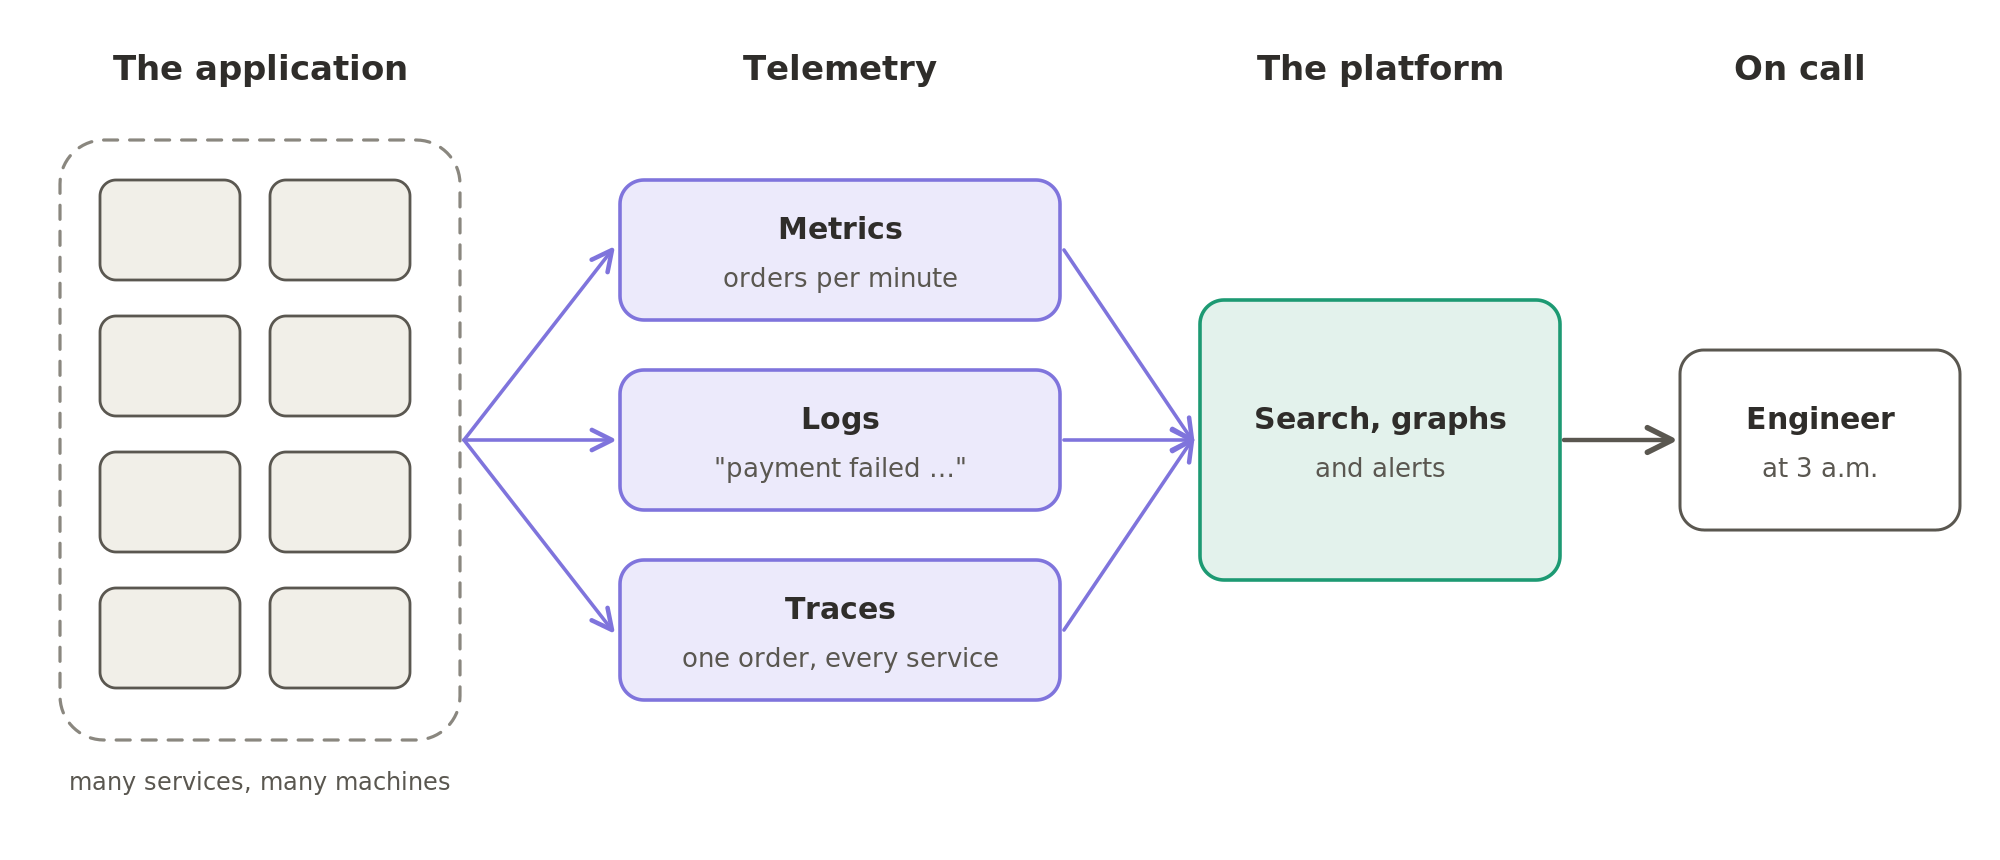 An instrumented application sends three kinds of telemetry, metrics, logs and traces, into one platform, which searches them, draws the graphs and raises the alert that reaches the engineer on call at three in the morning.
Together, this data is called telemetry. It has to be searched and turned into graphs. And when something breaks at three in the morning, it has to be turned into an answer, fast. The industry that sells the tools for this is called observability. It grew out of what used to be called monitoring. The people who use these tools are the engineers who keep the software running.
Every company named here has posted software engineering jobs in India. Famous companies that don't actively hire software engineers in India are left out.
This Market Segment has four sub-segments, and it follows the thing being watched. The first watches the application itself. The second watches the servers and the network underneath it. The third covers the newest idea: an AI model that watches all of it and answers the alert instead of a person. The fourth moves to the factory floor, where the same maths watches machines rather than software.
Watching the application
Application performance monitoring (APM), and metrics, logs and traces in one place
Back to the failing orders from the start of this Market Segment. The first question is which part of the software is failing. Two companies here watch the software itself.
New Relicis one of the older names in application monitoring. It sells a single platform, and an application sends its metrics, logs and traces into it. From there, a developer can follow one slow request through every service it touched. In our example, that means one failed order, followed from the app to the payment step. New Relic's engineers are in Hyderabad and Bengaluru.
Sumo Logicwith engineers in Delhi NCR and Bengaluru, began as log search in the cloud: the place where a company's machines send everything they write. It grew into a full observability platform, and it sells a security version beside it. Sumo Logic is covered mainly in this Market Segment, for its observability platform. Its security version is why it also appears in Market Segment 4.9, SIEM and security operations (SOC) (in Industry Vertical 4, Cybersecurity).
Datadog, the company that now defines this category, is not covered in this Market Segment. Neither are Dynatrace, Splunk, Elastic, Grafana Labs and Honeycomb, or the Indian observability start-ups SigNoz, Last9 and Middleware. AppDynamics is now part of Cisco. (More on Cisco in Market Segment 1.2, Enterprise networking, in Industry Vertical 1, Networking and telecom.)
Watching the infrastructure and the network
Monitoring servers and networks, AI for IT operations (AIOps), and watching the business journey
Back to the failing orders. Sometimes the code is fine, and the problem is underneath it: a server that has run out of memory, or a network link that is dropping traffic. The older half of this industry watches these machines and the network, rather than the code.
SolarWindswith engineers in Bengaluru, makes network and server monitoring for IT departments. It has added an observability platform on top. (More on the IT department's own tools in Market Segment 16.1, IT service management (ITSM) and IT operations software, in Industry Vertical 16, IT management and workplace tools.)
LogicMonitorwith engineers in Pune and Bengaluru, sells the same coverage from the cloud. It focuses on companies that run a mix of their own servers and cloud accounts. The industry calls this mix hybrid. The company's own servers are called on-premises, because they sit in its own building or data centre.
ScienceLogicwith an office in Hyderabad, sells monitoring for the largest and most mixed setups. It also sells to service providers, the companies that monitor such setups on behalf of others.
Virtanawith teams in Pune and Chennai, watches the storage and the performance of the infrastructure underneath.
The network has its own specialist:
Selectorapplies machine learning to the network's telemetry, the data that network equipment reports about itself. It groups related alarms together and points at the likely cause. Selector also appears in Market Segment 1.3, Network testing, visibility and monitoring (in Industry Vertical 1, Networking and telecom), for the same reason.
One company watches from the business's side, instead of the server's:
VuNet Systemsin Bengaluru, sells observability of the business journey rather than of the server. It follows a payment across the systems of a bank, to show where transactions are failing. (More on a bank's core systems in Market Segment 19.1, Core banking and banking as a service (BaaS), in Industry Vertical 19, Banking and regtech.)
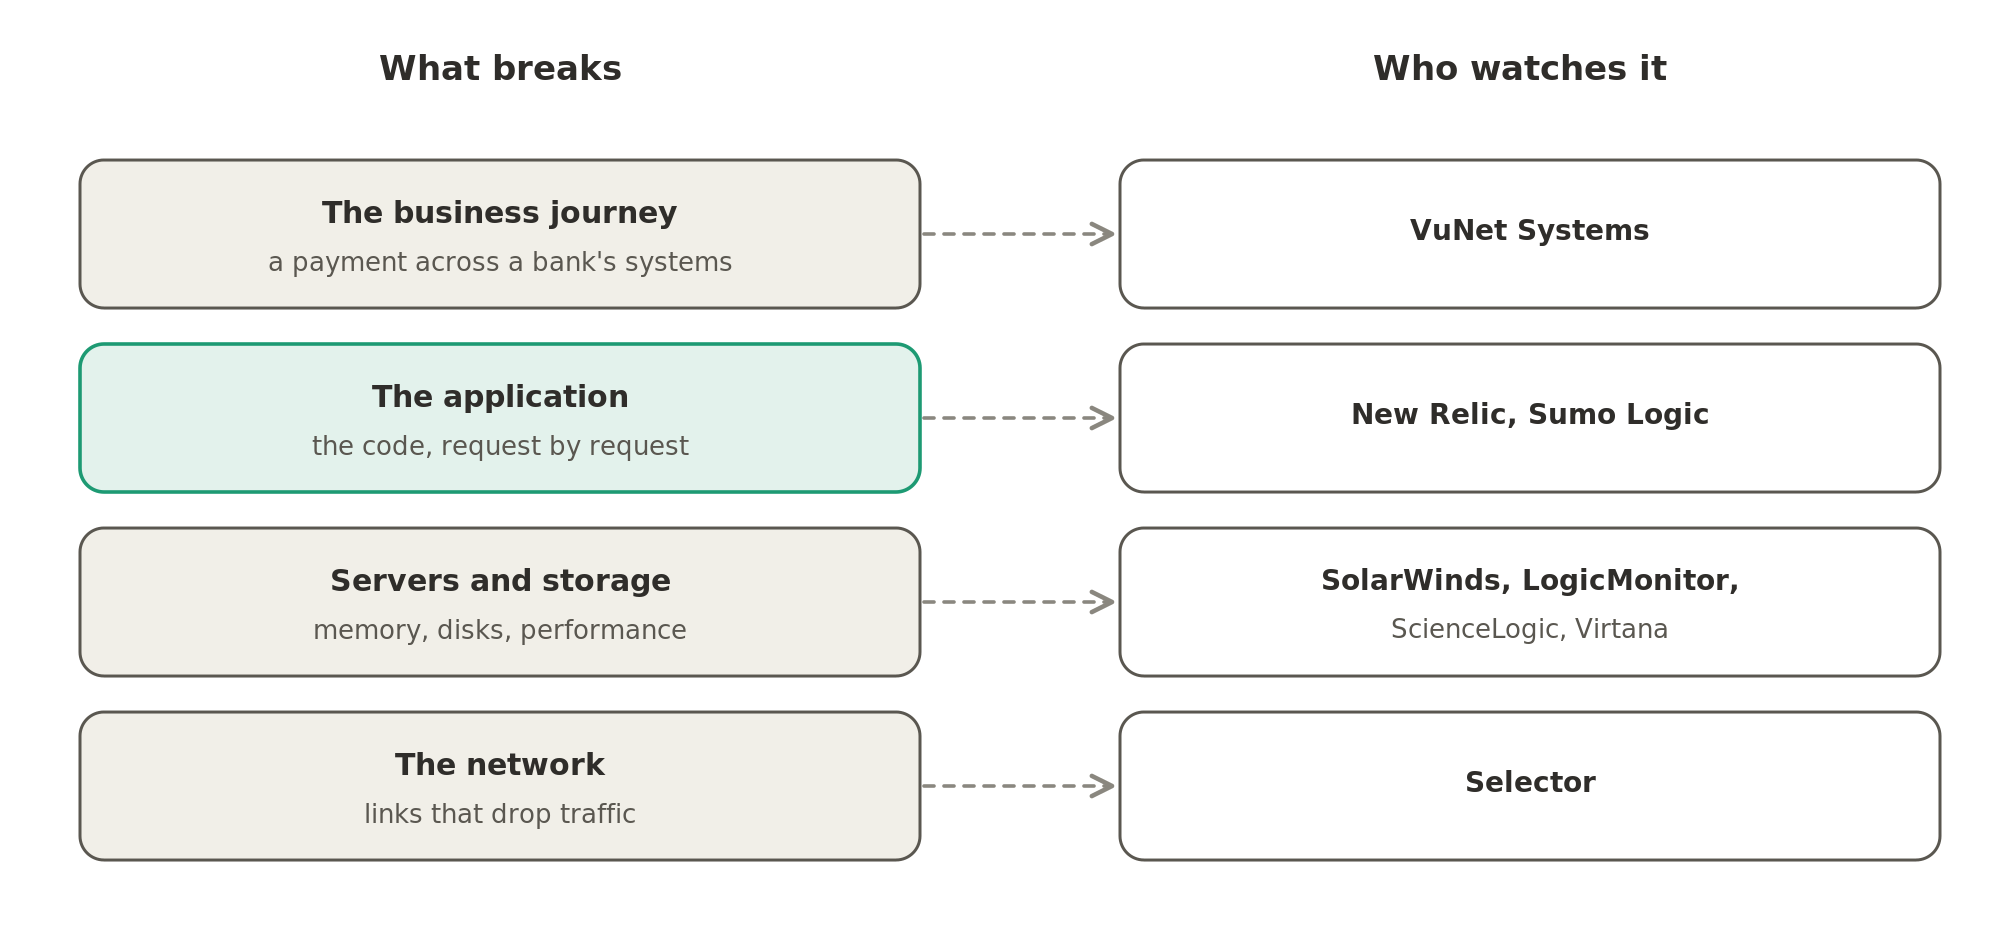 When late-night orders fail, the cause can sit in the business journey, the application, the servers and storage underneath it or the network, and different companies here watch each layer.
One company here works differently. Giggso, a small Chennai firm, describes its work as AI strategy, security and data engineering. It does not describe a monitoring product of its own.
You're reading as a guest. Sign in free to follow links for five minutes, once an hour.
Sign in
The model on call
AI for IT operations, finding the root cause automatically, and the AI site-reliability engineer
Back to three in the morning. The alert that wakes the engineer on call is called a page. Normally, the engineer then reads the logs, the traces and the recent changes to the code, and works out what broke. Three small companies sell an AI model that does this work instead, as the engineer on call. When the alert fires, the model does the reading. Then it either fixes the problem, or hands the human a diagnosis instead of just a page. This sub-segment is where the whole Market Segment is heading.
HEAL Softwarewith engineers in Bengaluru, is the earliest of them. Its platform is built to predict and prevent an incident from the signals that come before it. An incident is the industry's word for something breaking in production.
DrDroidis a Bengaluru start-up from Y Combinator's 2023 batch. Y Combinator is a well-known programme that funds young start-ups. DrDroid sells an AI agent that investigates an alert across the tools a team already has. An AI agent is software that uses a language model, the kind of AI behind chatbots, to take actions on its own.
Ciroosa California start-up with engineers in Bengaluru and Delhi NCR, has built the same idea from the start, as an AI site-reliability engineer. A site-reliability engineer (SRE) is an engineer whose job is to keep a live service running.
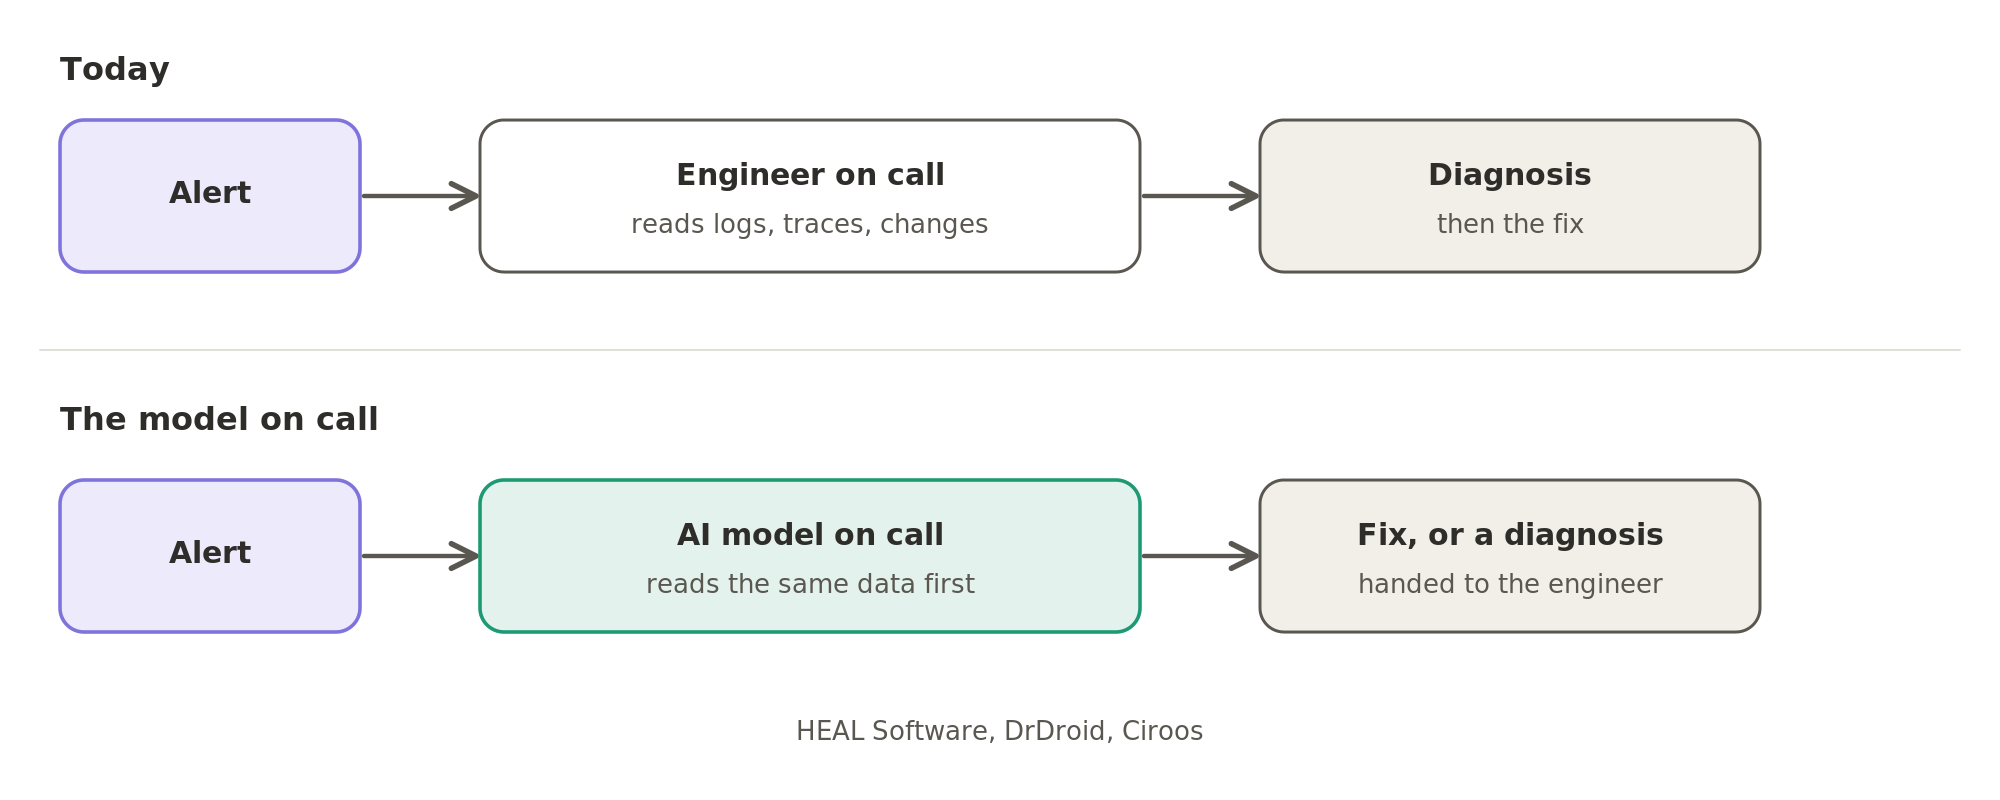 Today the alert wakes an engineer, who reads the logs, traces and recent changes to find the cause; in the model on call, an AI model reads them first and either fixes the problem or hands the engineer a diagnosis.
The page answered by a model.
Today the alert wakes an engineer, who reads the logs, traces and recent changes to find the cause; in the model on call, an AI model reads them first and either fixes the problem or hands the engineer a diagnosis.
The page answered by a model.
Every large platform in the first two sub-segments is building the same thing: an assistant that reads the telemetry and proposes the cause. The three companies here exist for nothing else. Being on call, taking turns to answer the alert at night, is the job in this Market Segment that AI models are most likely to change first.
The machine on the factory floor
Spotting unusual behaviour in industrial machines
The last sub-segment leaves software behind. In a factory, the same maths watches machines instead.
Falkonrywith engineers in Mumbai, sells anomaly detection over time-series data. Time-series data is a stream of readings taken again and again over time, such as a turbine's temperature every second. Falkonry's software learns what the stream normally looks like, and flags anything that departs from it. Its customers are industrial plants, and the readings come from turbines and presses. So Falkonry is covered mainly in Market Segment 37.4, Predictive maintenance and industrial IoT platforms (in Industry Vertical 37, Manufacturing tech). It appears here because the maths is the same as in the second sub-segment. Falkonry also describes its own product in the observability industry's words.
That is observability: tools that watch the application, the servers and the network underneath it, and the AI models that are learning to answer the alert themselves.